
I've been thinking a lot about how we evaluate product success lately. The BCG Matrix keeps coming up in product discussions, and while I get its appeal — it's clean, simple, and gives clear direction — I can't help but feel it misses so much of what makes modern products successful.
Background
The BCG Matrix stands for Bain Consulting Matrix and it was created by the founder, Bruce Henderson, and it's been guiding product portfolio decisions since the 1970s. At its peak (the 1970s–80s), the matrix was used by half of all Fortune 500 companies. In 2011, Harvard Business Review named it one of the five charts that "changed the world."
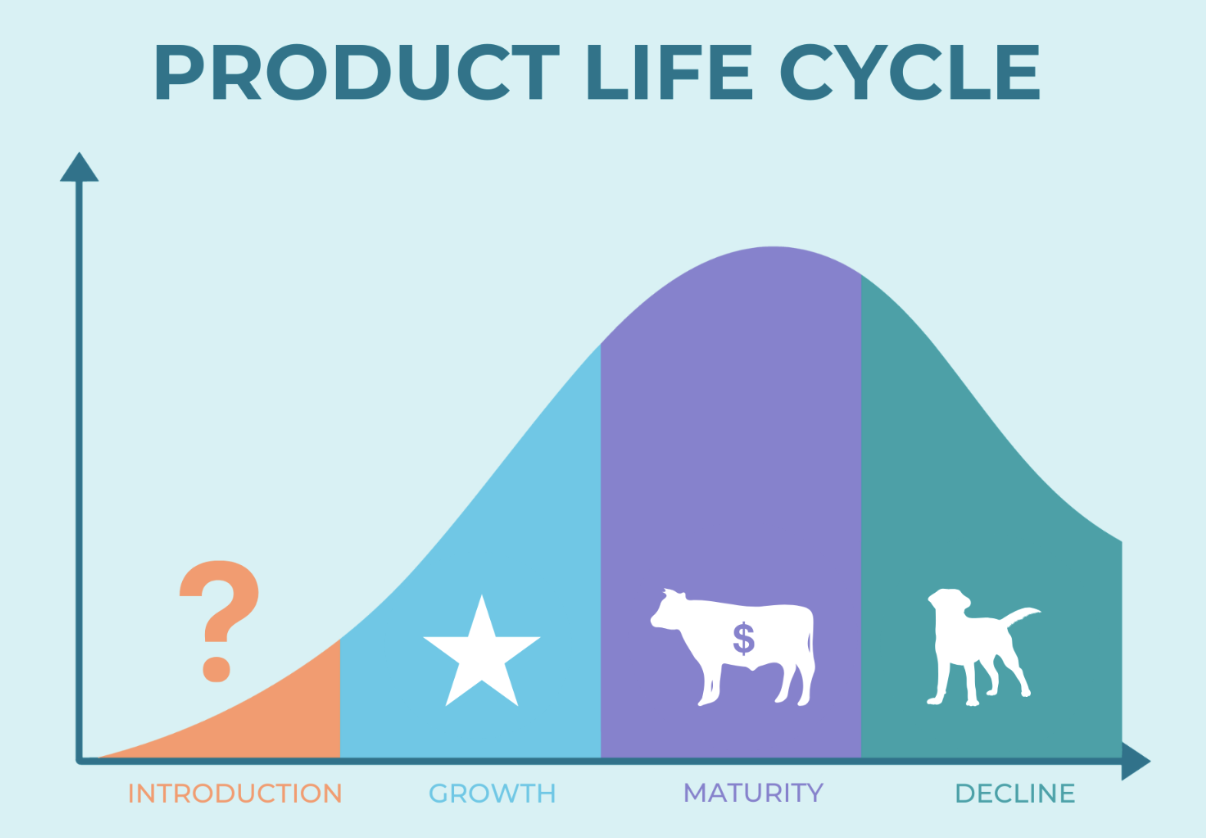
The BCG Matrix classifies products into four categories based on market growth and market share:
- Stars: High market share in growing markets
- Cash Cows: High market share in mature markets
- Question Marks: Low market share in growing markets
- Pets or Dogs: Low market share in mature markets
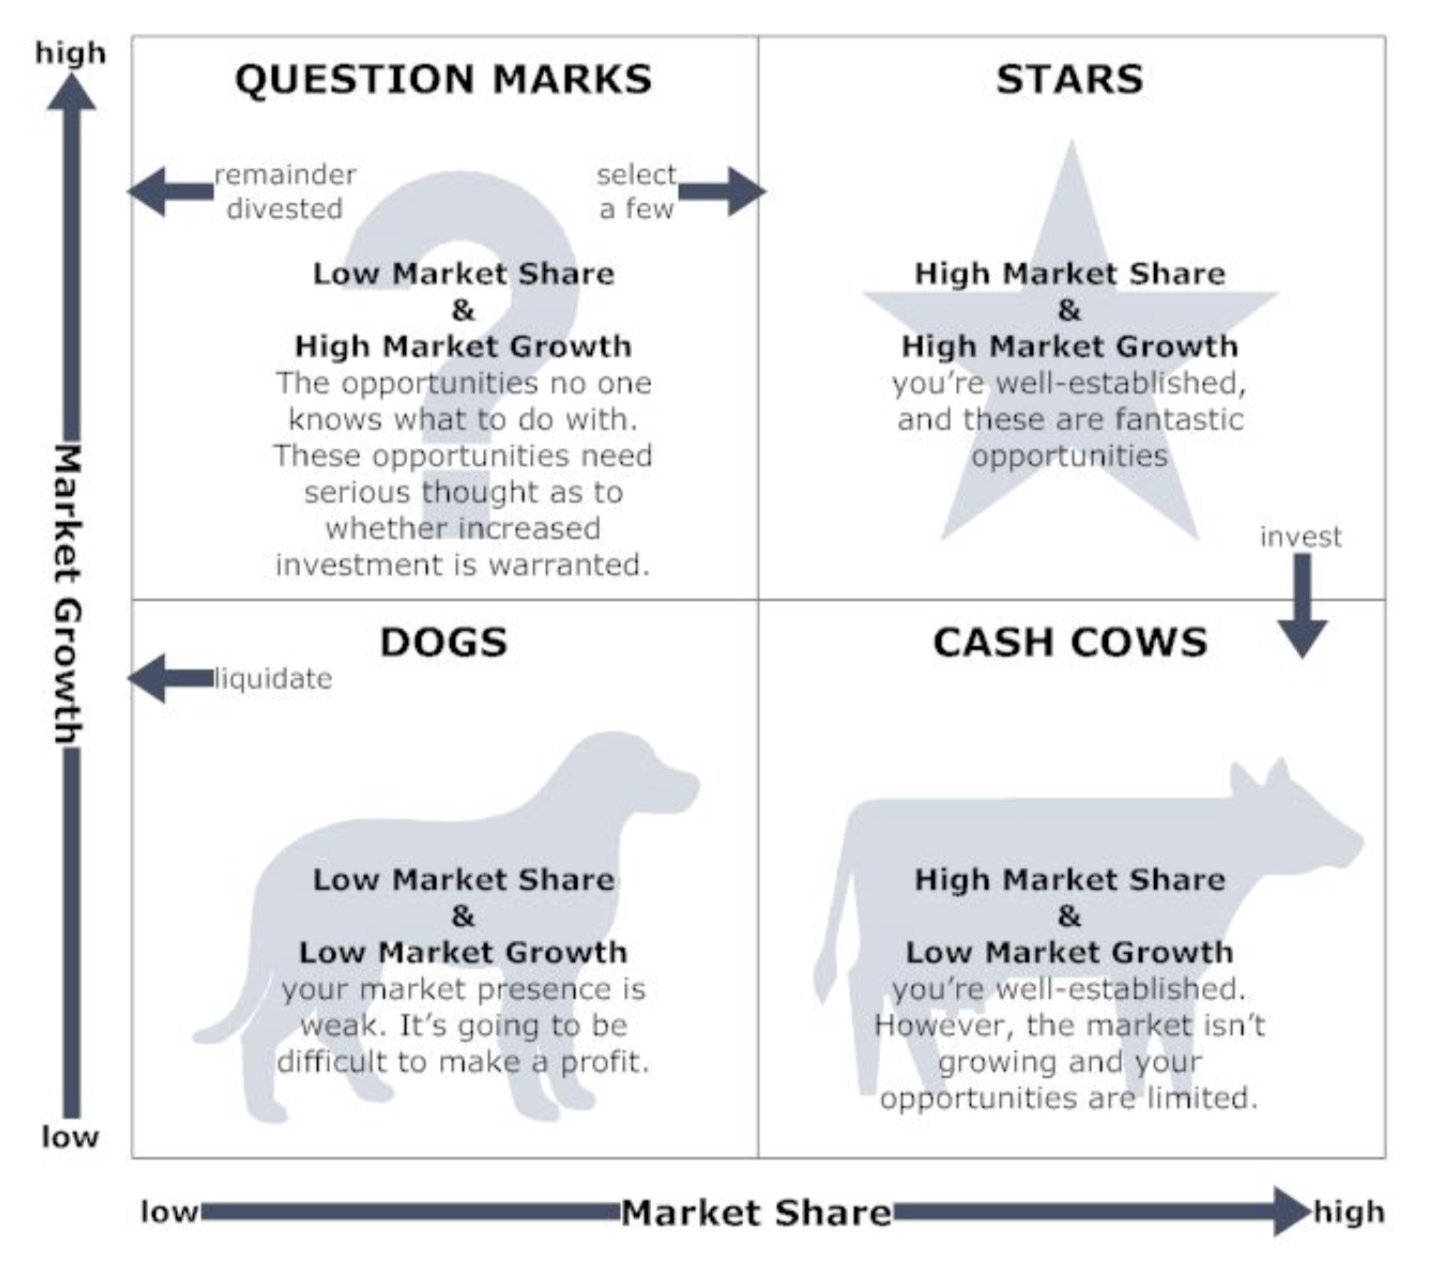
This matrix is used to answer a fundamental business question: How should we allocate resources across our product portfolio?
Use profits from Cash Cows to fund Stars and promising Question Marks, while divesting from Dogs. This seems logical. Reinvest profits from successful mature products into high-potential growth opportunities.
There's a lot of assumptions in the Matrix. For example, it assumes you're entering existing markets with defined growth rates and market shares. But what about products that create entirely new markets? Netflix's streaming service and Amazon's AWS are perfect examples. Neither would have made sense through the BCG lens.
Amazon Web Services
When Amazon Web Services (AWS) launched in 2006, it required substantial investment in infrastructure and software development to support cloud services. Amazon had to build massive data centers and purchase hardware — all for a service that, at the time, was an unproven business model.
Despite the high growth potential of cloud computing, AWS started with a small market share. It took nine years and around $5–6 billion in investment before AWS turned its first profit of $1.85 billion in 2015. Amazon didn't even break even until a year or two after that. If Amazon had evaluated AWS using the BCG Matrix during corporate strategy planning, it might have decided to cut its losses, as the product was burning through cash without immediate returns.
But Amazon stuck to its vision. Fast forward to 2022, AWS generates around $22 billion in profit annually, becoming one of the most critical drivers of Amazon's revenue. If Amazon had applied the BCG Matrix too rigidly, the company could have abandoned one of the most profitable tech ventures of the 21st century.
Netflix
In the early 2000s, when Netflix's profits were doubling every year, the matrix would have said that the DVD business was a Star with potential to mature into a cash cow (the ultimate goal) — high market share, steady revenue, and no reinvestment needed. The logical step would have been to milk this profitable business for as long as possible, avoiding unnecessary risks.
However, Netflix took a bold, counterintuitive approach. Instead of simply maximizing its DVD rental profits, the company decided to pivot its business model away from DVD rentals by delivering the entertainment content in a completely new and different way — streaming. At the time, streaming was an unproven risk, and the market would only be those households that had broadband internet, providing the speed needed to watch a movie without interruption.
It was a bold move because they were inventing a market that didn't fully exist yet, relying on improving internet speeds and changing consumer habits to make it work. If Netflix had used the BCG Matrix back in the early 2000s, the matrix would have advised Netflix to focus on building up its DVD rental business even more, milking this profitable business for as long as possible, avoiding unnecessary risks. Netflix instead might have shifted more resources into DVDs rather than streaming.
By betting heavily on streaming and content creation, Netflix cannibalized its own DVD successes to pursue a larger opportunity, which ultimately reshaped the entertainment industry.
Think about WhatsApp for a minute. Early in its lifecycle, traditional metrics might have labeled it a Question Mark — low market share in a growing messaging market. But that completely misses what makes messaging apps valuable. WhatsApp grew to billions of users not because of market share, but because of network effects. Each new user made the platform more valuable for everyone else, creating a powerful growth engine that the BCG Matrix simply doesn't capture.
The same story played out with LinkedIn. Its value isn't just about market share in the professional networking space — it's about becoming the default platform for professional identity. The BCG Matrix might tell you about LinkedIn's market position, but it wouldn't capture how the platform becomes increasingly valuable as more professionals join and engage with it.
Sometimes, what looks like a Dog in traditional terms might actually be the foundation of your next platform play. That's because modern product success rarely fits into neat quadrants. And when you look closer, these success stories point to something crucial about modern product management: it's not just about where your product sits in today's market, it's about understanding how it might reshape tomorrow's market. Network effects, user trust, developer ecosystems, data advantages — these factors often matter more than pure market share or growth rates.
The BCG Matrix isn't wrong; it's just incomplete. You wouldn't want to navigate a city with a 2D map when you're actually moving in three dimensions. Modern products create value in ways that Bruce Henderson couldn't have imagined in the 1970s.
And the most valuable products often don't win by dominating existing markets — they win by creating new ones. The key is knowing when to trust the framework, and when to look beyond it. The takeaway is that product success isn't about fitting into the right quadrant — it's about understanding how your product creates value in ways no quadrant can capture.